SFM Tracker
Weekly Top 20 Predictions by League
Log in to access all leagues.
Season to date: Premier League (Completed Games Only)
Every graded pick so far. The boards below show each league's next round.SFM Top 20 Predictions
Naive Top 20 Predictions
32.8% vs 30.0% (+2.8 pp)
Brier Score: Premier League
Calibration: Premier League
Hit Rate Over Time: Premier League (SFM vs Naive)
Premier League 2026/27 GD08 Upcoming
| Rank | Player | vs | SFM | Result |
|---|---|---|---|---|
| 1 |

 Erling Haaland |
 Aston Villa |
64.4% | Pending |
| 2 |

 Alexander Isak |
 Brighton & Hove Albion |
55.1% | Pending |
| 3 |

 Joao Pedro 10 |
 Tottenham Hotspur |
47.4% | Pending |
| 4 |

 Bryan Mbeumo |
 AFC Bournemouth |
43.7% | Pending |
| 5 |

 Kai Havertz |
 Everton |
38.0% | Pending |
| 6 |
 Bukayo Saka |
Everton |
35.5% | Pending |
| 7 |
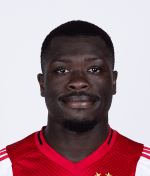
 Brian Brobbey |
 Leeds United |
35.3% | Pending |
| 8 |
 Morgan Rogers |
Tottenham Hotspur |
32.5% | Pending |
| 9 |
 Benjamin Sesko |
AFC Bournemouth |
32.4% | Pending |
| 10 |
 Nicolas Jackson |
Manchester City |
31.1% | Pending |
| 11 |
 Cole Palmer |
Tottenham Hotspur |
30.9% | Pending |
| 12 |
 Bruno Fernandes |
AFC Bournemouth |
30.9% | Pending |
| 13 |
 Dominic Calvert Lewin |
Sunderland |
30.2% | Pending |
| 14 |

 Zian Flemming |
 Nottingham Forest |
27.0% | Pending |
| 16 |

 Joergen Strand Larsen |
 Newcastle United |
25.9% | Pending |
| 17 |

 Kevin Schade |
 Hull City |
25.9% | Pending |
| 18 |
 Matheus Cunha |
AFC Bournemouth |
25.5% | Pending |
| 19 |
 Arnaud Kalimuendo Muinga |
Ipswich Town |
25.1% | Pending |
| 20 |
 Emanuel Emegha |
Tottenham Hotspur |
24.9% | Pending |
| 19 |
 Dan Ndoye |
Ipswich Town |
24.7% | Pending |
| 4 |
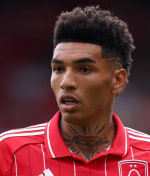 Igor Jesus |
Ipswich Town |
24.2% | Pending |
| 5 |
 Liam Delap |
Ipswich Town |
23.8% | Pending |
| 17 |
 Emersonn |
Nottingham Forest |
23.6% | Pending |
| 20 |
 Cody Gakpo |
Brighton & Hove Albion |
22.9% | Pending |
| 6 |
 Chris Wood |
Ipswich Town |
22.0% | Pending |
| 7 |
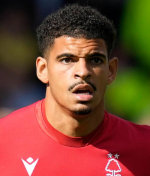 Morgan Gibbs White |
Ipswich Town |
20.8% | Pending |
| 8 |
 Chuba Akpom |
Nottingham Forest |
18.2% | Pending |
| 12 |
 Callum Hudson Odoi |
Ipswich Town |
13.6% | Pending |
| 13 |
 James Mcatee |
Ipswich Town |
13.1% | Pending |
| 10 |
 Jaden Philogene Bidace |
Nottingham Forest |
13.0% | Pending |
| 11 |
 Julio Enciso |
Nottingham Forest |
12.9% | Pending |
| 15 |
 Nicolas Martin Dominguez |
Ipswich Town |
8.9% | Pending |
| 14 |
 Exequiel Palacios |
Nottingham Forest |
8.2% | Pending |
Understanding Hit Rate vs Brier Score
You might notice that hit rate and Brier Score can tell different stories.
Hit Rate
Simply counts: "How many of my top 20 picks scored?"
A naive model that always picks proven strikers (Haaland, Kane) will have a high hit rate because these players score often, regardless of the match context.
Brier Score
Asks: "How accurate were the probability estimates?"
If SFM says "32% chance" and Naive says "38% chance" for the same player who doesn't score, SFM gets a better Brier Score because its estimate was closer to reality.
SFM Tracker
Top 20 Selection
For each league and gameday, we select the 20 players with the highest median probability of scoring at least one goal as predicted by the SFM.
Frozen Predictions
Predictions are locked before matches are played. This ensures transparent, verifiable performance tracking.
Fair Comparison
We compare SFM's top 20 picks against Naive's own top 20 picks (ranked by historical average). This is apples-to-apples.
Brier Score
Evaluation metric for probabilistic predictions. Measures both calibration and discrimination. Lower is better.